


Flow cytometry assay
- 2026-07-10
- 319
Flow Cytometry (FCM) is a technique that enables rapid multi-parameter comparison, analysis, and sorting of individual cells based on different fluorescent signals and wavelengths. The principle involves a sample stream, enclosed in sheath fluid under pressure, passing through laser illumination. The instrument collects the resulting optical signals, converts them into electrical signals, and finally processes the data via a computer system to display the results in more intuitive formats such as scatter plots, histograms, or other types of graphs.First, the sample must be processed into a single-cell suspension, with care taken to minimize bubble formation. After preparation, the sample should be filtered and incubated with fluorescent dyes under low-temperature conditions before loading it into the machine. Only after incubation is completed can the sample be analyzed using the flow cytometer.
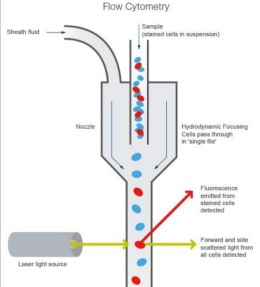
Flow cytometry was first applied in the field of medicine and has become crucial for research in immunology, oncology, cytology, and other disciplines. It can be used to analyze and detect cells, such as in experiments involving apoptosis, differentiation, and proliferation. Flow cytometry is also applicable in plant studies, including nuclear analysis and ploidy analysis. Flow cytometry (FCM) is a highly sensitive, accurate, and time-efficient technique for processing large sample volumes.
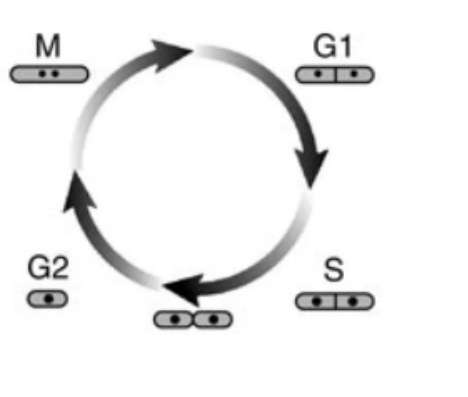
Flow cytometers have stringent requirements for samples. First, a single-cell suspension must be obtained. Second, the cell count should be around 1×10^6—too few cells may increase the coefficient of variation and introduce experimental errors, while too many cells may lead to uneven binding when adding dyes or antibodies. Additionally, if two markers are used simultaneously, their fluorescent labels must not overlap in color. Different experimental objectives require different staining reagents, so an appropriate dye must be selected based on the specific conditions. The dye should be added 30 minutes before loading the samples for light-protected incubation.For example, when analyzing the cell cycle, propidium iodide (PI) is commonly used as a staining reagent. PI binds to dsDNA or base pairs, and the fluorescence intensity correlates with the amount of chromosomal DNA in the cells. Since DNA content varies across different cell cycle phases, flow cytometry can be used to determine the cell cycle stage after sample analysis.
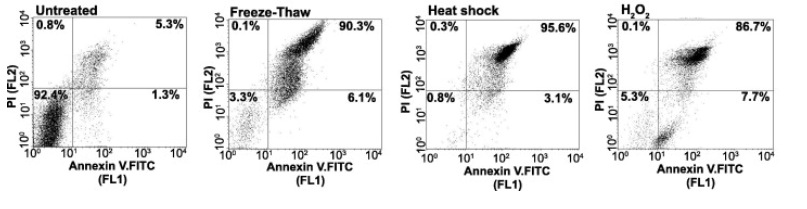
When using flow cytometry to detect apoptosis, the changes in cells can be observed in the scatter plots generated after sample loading. In the early stages of apoptosis, the cell membrane remains intact, preventing propidium iodide (PI) from entering the cell. As a result, these cells appear in the lower-right quadrant of the scatter plot. As apoptosis progresses to the late stage, membrane permeability increases, allowing PI to penetrate the cells. Consequently, the necrotic cells gradually shift in the plot and eventually appear in the upper-right quadrant.

- Protein Platform
- Protein Expression Services
- Protein Modification & Detection Services
- Protein Interaction Services
- Protein Purification Service
- Antibody Discovery Platform
- VHH Antibody Platform
- Phage Display Platform
- Antibody Humanization Platform
- Single B Cell Screening Platform
- Antibody Expression & Validation Platform
- Peptide Library Platform
- Custom Antibody Platform
- Innovative Drug Discovery Platform
- Product Center
- Proteins
- Antibodies
- Raw Materials Reagents
- Small Molecule Reagents
- Peptide Products
- Nanoparticle Products
- Contact Us
- Phone:400-621-6806
- Mobile:13110936064(WeC
- E-mail:[email protected]
- Address:Room 108, Building 10, No. 6 Hechang Road, Wuqing Development Zone, Tianjin City
-

WeChat
-

Service Account
-
 400-621-6806
 -
 3599163699
 -
 Monday to Friday 9:00-18:00
 -

-
 0
0
-
